gnocchi 4 introspective: measuring the measure store
preface: for full disclosure, i contribute to the Gnocchi project. also, this is not about pasta. the following only reflects changes between Gnocchi 3 to Gnocchi 4. i’ve yet to decide whether i will do a detailed write-up on changes made from Gnocchi 2 to Gnocchi 3 but you can watch a quick vBrownBag talk i gave on the topic or glance through a detailed deck.
Roughly three years ago, developers in OpenStack set out on a mission: to build a scalable, time series optimised, storage service capable of capturing metrics about resources in a cloud. The product of this exploration was Gnocchi. Since its origin, Gnocchi has been designed to be horizontally scalable and because of that, it is infinitely scalable! “Too slow? Add more workers. Problem solved! Science!”
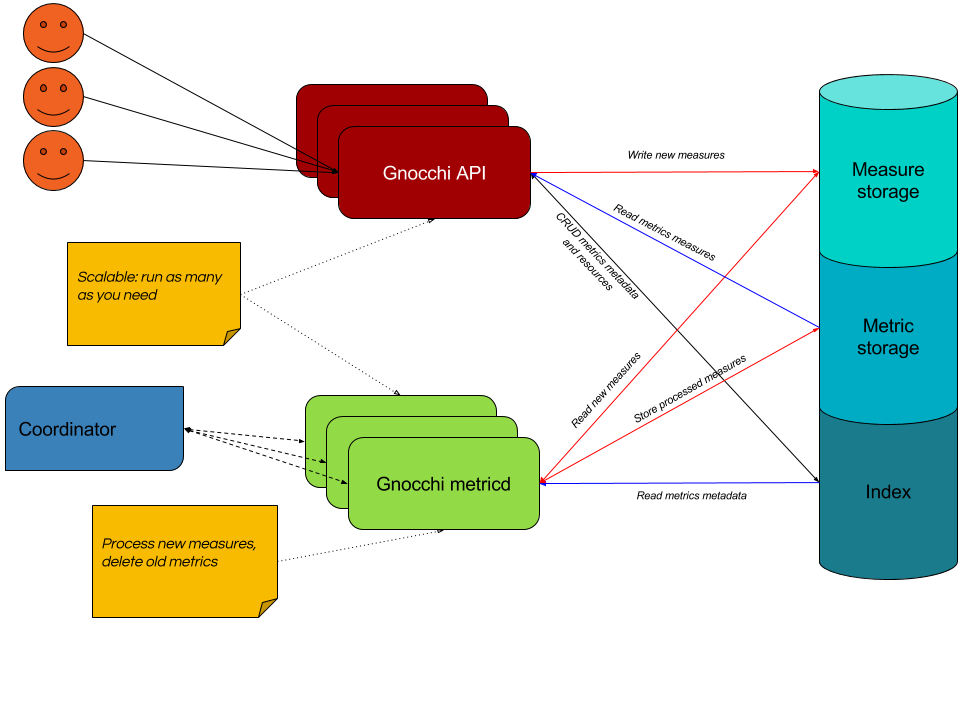 figure 1: Gnocchi 4 architecture (Julien Danjou 2017)
Unfortunately, while evaluating Gnocchi 2 as a potential time series database, it was soon realised that the amount of horizontal scaling required for Gnocchi to handle the desired use case rendered it unusable. Various changes were made to address the faults of Gnocchi 2 based on the initial evaluation.
This continues the ongoing story of how the team is working on improving Gnocchi through performance testing to make it scalable rather than “scalable”.
building a test case
The test case used to measure performance is built around the following use case: ingest minute data spanning a few hours for hundreds of thousands of metrics periodically. The data should be retain for a year.
Using this scenario, Gnocchi is tested by simulating 1K resources with 20 metrics each and pushing batched measures periodically.
see Additional Info for test environment details
in-memory performance
As of Gnocchi 3, deploying 32 API workers on a single node enabled Gnocchi to write nearly a million measures per second (~970K measures/s) when pushing measures in 5K batches.
To improve upon this, it was noted that incoming data in reality has a short lifespan before it is processed into the storage backend. Given this condition, writing incoming data to memory can greatly improve the write throughput of Gnocchi. To satisfy this requirement, Gnocchi has added support for Redis and for the Ceph driver to leverage the underlying LevelDB/RocksDB Ceph uses to store omaps.
Using Ceph’s benchmarking tool shows the potential write improvements of storing new measures as omaps rather than objects as Gnocchi 3 does.
$ rados bench -p gnocchi 120 write -t 32 — write-object -b 512
Total time run: 120.216177
Total writes made: 1220965
Bandwidth (MB/sec): 4.95919
Stddev Bandwidth: 3.09356
Max bandwidth (MB/sec): 7.82568
Min bandwidth (MB/sec): 0.00195312
Average IOPS: 10156
Stddev IOPS: 6335
Max IOPS: 16027
Min IOPS: 4
Average Latency(s): 0.00314982
Stddev Latency(s): 0.030401
Max latency(s): 2.6162
Min latency(s): 0.00106848
vs.
$ rados bench -p gnocchi 120 write -t 32 — write-omap -b 512
Total time run: 120.001801
Total writes made: 1606607
Bandwidth (MB/sec): 6.5372
Stddev Bandwidth: 2.0134
Max bandwidth (MB/sec): 8.27539
Min bandwidth (MB/sec): 0.710938
Average IOPS: 13388
Stddev IOPS: 4123
Max IOPS: 16948
Min IOPS: 1456
Average Latency(s): 0.00238943
Stddev Latency(s): 0.0100267
Max latency(s): 0.978732
Min latency(s): 0.00104604
The result of this switch enables Gnocchi 4 to record more than 1.3M measures/s – up to 40% more measures than Gnocchi 3 – with a smaller cluster in Ceph’s case. Gnocchi 2 and 3 tests were run against a 30OSD Ceph cluster compared to a 20OSD cluster for Gnocchi 4. (hardware retention in IT is a hard knock life)
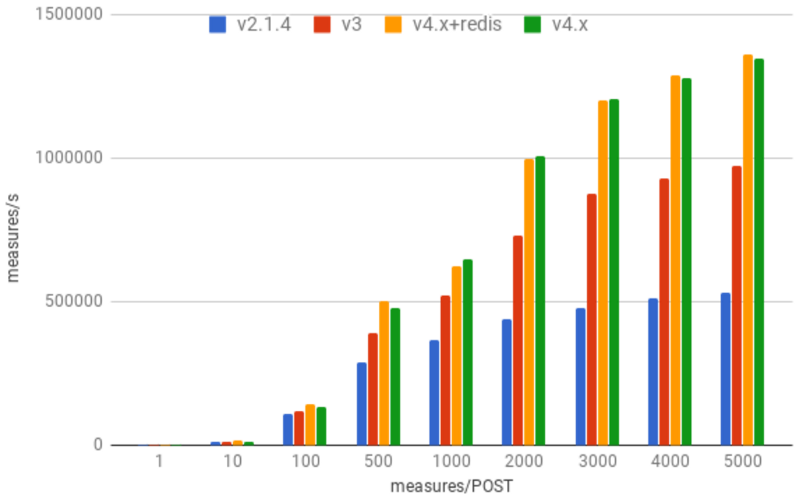 figure 2: 4 clients running benchmark with 12 threads each against 32 process uwsgi service
It should be noted that writing to memory has a lesser effect on small requests where the round-trip of a REST call outweigh internal I/O.
numpy v. pandas
In Gnocchi 4.x, most of the core functionality was switched from Pandas to Numpy. The reasoning for this was two-fold: first, Pandas is a “data structures and data analysis tools for the Python programming language” which for the basic workflow of Gnocchi, the majority of the functionality was never leveraged; and second, the N-dimensional array structures used in Gnocchi performed better when implemented with Numpy rather than Pandas.
At the time of publication, by removing the dependency on Pandas for services which don’t require it, the memory requirements for Gnocchi drops ~35%.
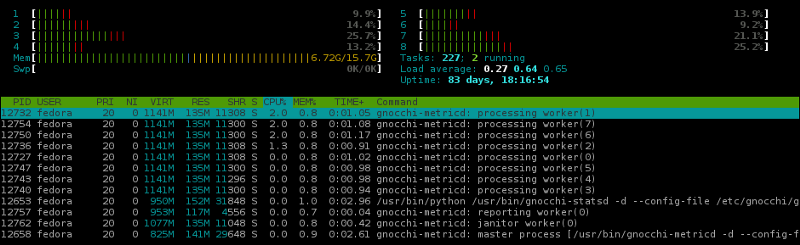 figure 3: gnocchi-metricd with Pandas loaded
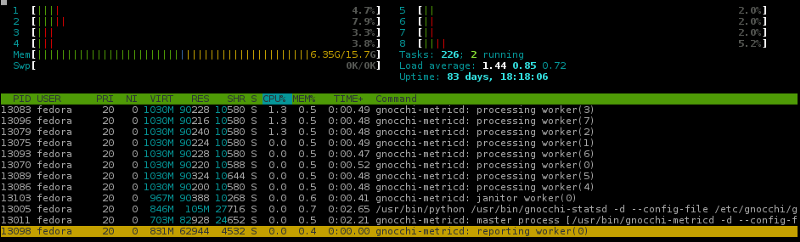 figure 4: gnocchi-metricd service with less Pandas
From a performance standpoint, the switch from using Pandas to Numpy for processing incoming measures yields a 10% to 20% performance boost in the defined test case.
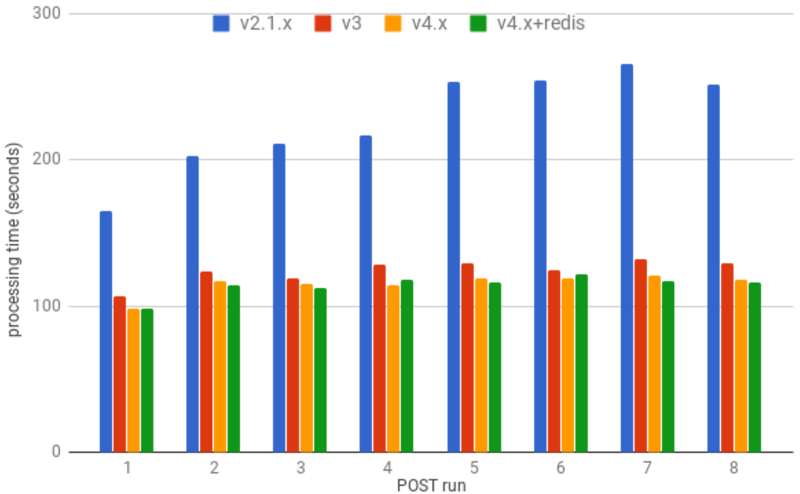 figure 5: time to process 20K metrics with 60 points each using 18 workers
scheduling & sharding
As mentioned above, much of the testing involved periodically shoving batched data into Gnocchi — the changes in Gnocchi 3 were heavily driven by this use case. Unfortunately, this is not the only use case. Specifically, Ceilometer’s default integration with Gnocchi behaves differently where measures are not batched over time on the same metric but rather they are batched by varying individual metrics at a given time.
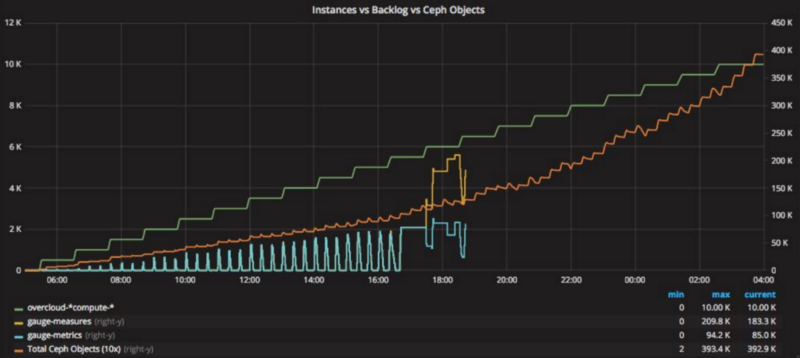 figure 6: Gnocchi exploding attempting to capture 550K+ metrics (Alex Krzos 2017)
When attempting to measure 10K virtual machines in OpenStack, it became evident that Gnocchi’s scheduling did not gracefully handle the workload sent by Ceilometer.
The failure was attributed to two main issues. The first issue was that incoming measures were queued as keys in a single object in Ceph which resulted in zero distribution and everything getting funnelled into a single placement group. Secondly, the scheduling logic ineffectively attempted to partition the front of the incoming measures across existing workers as shown in Figure 7.
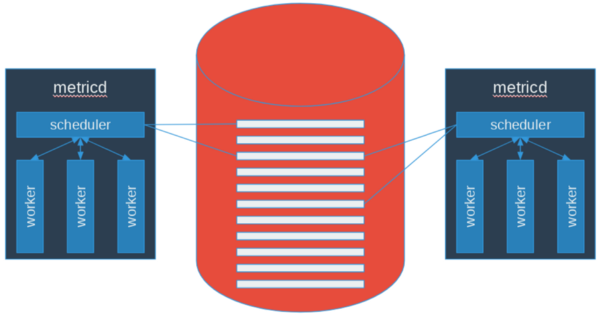 figure 7: Gnocchi 3 scheduling logic
The scheduling logic would fail because it behaved more like a stack than a queue and therefore, depending on the backlog size and the number of active workers, the measures at the end could be starved and never scheduled for processing.
To address the first issue, sharding logic is introduced which partitions all incoming writes across a specified number of sacks. This results in better distribution of data on the incoming storage driver.
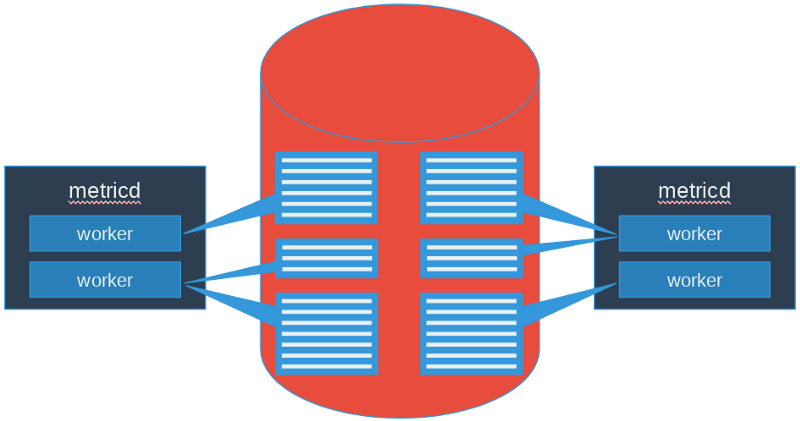 figure 8: Gnocchi 4 scheduling logic
In addition to sharding, a new scheduling logic was implemented to distribute sacks across all available workers using consistent hashing. As there are now many smaller sacks compared to a single giant stack previously, every sack can now be fully scheduled and therefore, no measures are left unprocessed in a processing cycle.
The result of this change is improved handling of many unbatched measures:
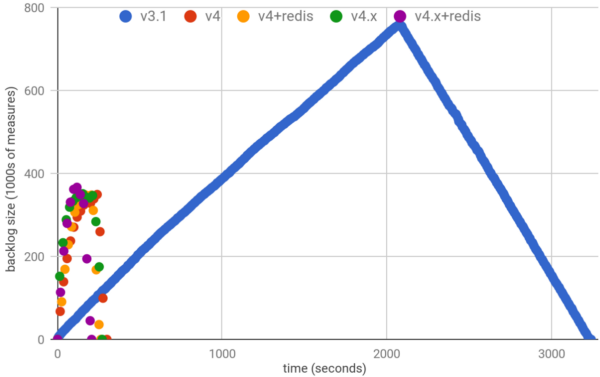 figure 9: Gnocchi backlog after 1.2M individual measures for 20K metrics streamed
Using 1/3 the number of workers with Gnocchi 4 as Gnocchi 3, the backlog of unprocessed measures peaks ~50% lower than the highest number of unprocessed measures in Gnocchi 3.
Furthermore, Gnocchi 4 is able to process all 1.2M individual measures 10x quicker than Gnocchi 3
Running tests against the original test case shows Gnocchi still handles the batched measures scenario well.
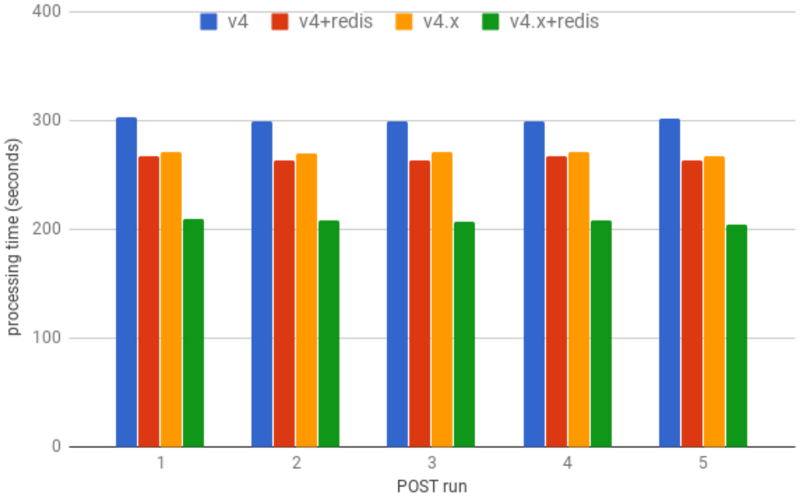 figure 10: time to process 20K metric, 60 points each
With 18 workers, Gnocchi 4 can process 20K metrics with 60 measures each in less time than Gnocchi 3, running 3x more workers.
tl;dr
The upcoming release of Gnocchi 4 updates the incoming storage drivers, the underlying processing tool, and the scheduling logic which enables Gnocchi to: write faster, use less memory, and better handle large datasets of unbatched measures with less resource requirements.
additional info
More measurements and details on the test environment can be found in original deck.